


U.S. National Parks in Numbers: A Look at the Stats That Define America’s "Best Idea"
Everything from budget and economic impact to employment and infrastructure.

The United States’ national park system is one of the country’s greatest achievements in both conservation and recreation.
With stunning landscapes, diverse wildlife, and rich historical and cultural significance, the parks attract many millions of visitors every year and contribute significantly to the nation’s economy.
The National Park Service in Numbers: Budget, Employment, Economic Impact, Infrastructure & More
This article takes a look at the National Park Service by the numbers, highlighting the key statistics that define these treasured sites.
Total Number of Sites in the National Park System
The National Park System, managed by the National Park Service (NPS), includes more than just national parks.
As of 2025, the system comprises 433 individual sites, often called "parks," spread across all 50 states, the District of Columbia, and U.S. territories. These sites are divided into different designations, including:
63 national parks
86 national monuments
76 national historic sites
63 national historical parks
31 national memorials
19 national preserves
18 national recreation areas
11 national battlefields
10 national seashores
6 national scenic trails
4 national parkways
And more specialized designations
Each designation serves a specific purpose, whether for conservation, recreation, historical preservation, and/or education.
See the full list of all 433 National Park Service sites here.
Annual Visitors to National Parks
The national parks system is one of the most visited recreational networks in the world. In 2024, the NPS reported over 331.9 million recreational visits to all its sites combined, which is a record. Never in the history of the National Park Service have the parks been more popular.
Among the most-visited national parks in 2025, the top ten include:
Great Smoky Mountains National Park – 12.19 million recreational visits
Zion National Park – 4.95 million recreational visits
Grand Canyon National Park – 4.92 million recreational visits
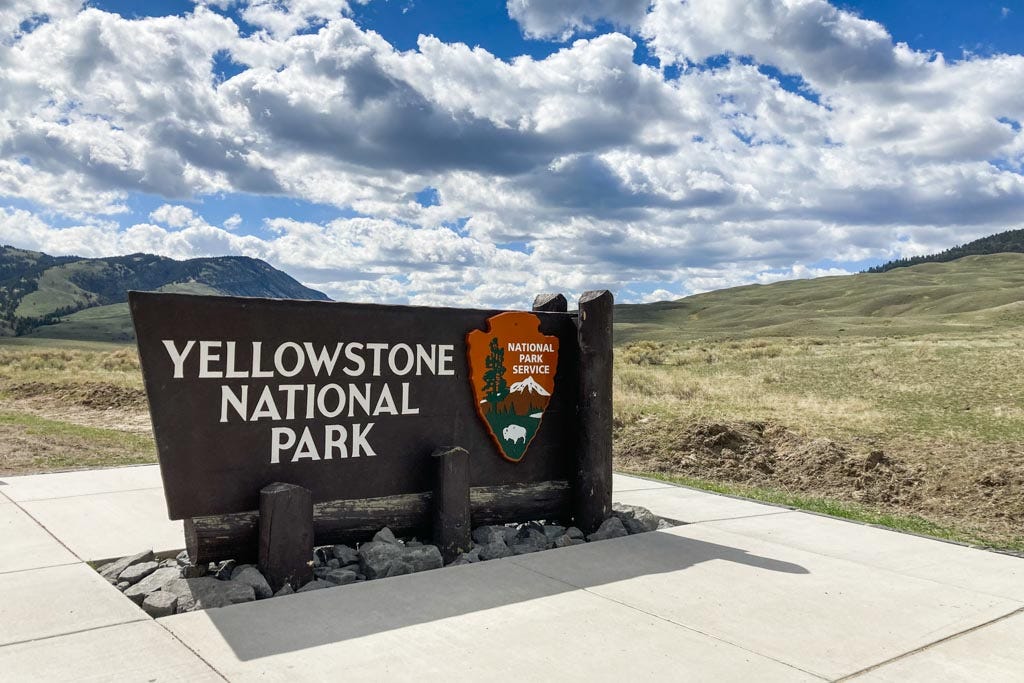
Yellowstone National Park – 4.74 million recreational visits
Rocky Mountain National Park – 4.15 million recreational visits
Yosemite National Park – 4.12 million recreational visits
Acadia National Park – 3.96 million recreational visits
Olympic National Park – 3.72 million recreational visits
Grand Teton National Park – 3.63 million recreational visits
Glacier National Park – 3.21 million recreational visits
These numbers illustrate the immense popularity of the national parks and their importance as travel destinations among both Americans and foreign tourists alike.
Explore all kinds of NPS visitation statistics here.
Economic Impact of National Parks
National parks play a crucial role in the U.S. economy. According to NPS reports, visitors spent a total of $26.4 billion in gateway towns when visiting national park sites across the entire country in 2023. That's also a record.
That spending directly supported no fewer than 415,000 jobs (both parttime and fulltime), many of which are in tourism, hospitality, and retail. It also generated $19.4 billion in labor income (wages and salaries); and $32.0 billion in value added (net contribution to the national GDP).
Visitor spending resulted in a record-high $55.6 billion benefit to the U.S. economy in 2023 (known as "economic output," which is the sum of business-to-business sales, exports, and sales to consumers).
Some key economic figures include:
Lodging: Visitors spent $9.9 billion on accommodations near national parks.
Food and beverages: Tourists spent $5.2 billion on dining options in and around national park locations.
Gas: Visitors spent $2.8 billion on fuel while visiting national park sites.
Recreation: Visitors spent $2.2 billion on equipment rentals, activities, guided tours, and related services.
Retail: National park visitors spent $2.1 billion in retail shops near parks.
Transportation: People traveling to and from national parks spent $1.9 billion on local transportation.
States with the highest economic benefits from national park tourism include, from high to low, California, North Carolina, Utah, Alaska, Virginia, Tennessee, Arizona, and Wyoming. These are the states with the highest number of NPS sites and/or the most popular national parks.

Funding of the National Park Service
The National Park Service budget request for Fiscal Year 2025 is $3.58 billion, which is merely 0.067% of the total annual federal budget.
When considering that the national parks generate an economic output of $55.6 billion per year, that means that for every $1 spent on the National Park Service, the parks generate $15 in economic output (total sales and exports).
Employment in the National Park System
The National Park Service employs thousands of individuals across a wide range of roles. As of 2024, the NPS workforce includes:
19,778 permanent, temporary, and seasonal fulltime employees in Fiscal Year 2024
More than 138,000 volunteers in Fiscal Year 2024
These employees include park rangers and guides, construction and maintenance staff, archaeologists, wildlife biologists, engineers, firefighters, search-and-rescue workers, and law enforcement officers, all dedicated to preserving and protecting the parks.
NOTE: As the result of mass firings and a federal hiring freeze, the total NPS workforce has been reduced dramatically this year. About 1,000 fulltime probationary employees were indiscriminately terminated in February, while another 700-1,000 accepted a resignation offer. In effect, this means that about 13% of the entire NPS workforce was lost in just a couple of months. Combined with budget cuts and another pending reduction-in-force, this may result in potential closures, program cancellations, long lines, increased littering and damage, and delayed search-and-rescue response this summer.

Protected Land and Wildlife Conservation
The National Park System collectively protects over 85 million acres of land in all 50 states, the District of Columbia, and overseas territories. Some of the largest national parks include:
Wrangell-St. Elias National Park and Preserve (Alaska) – 13.2 million acres
Gates of the Arctic National Park and Preserve (Alaska) – 8.5 million acres
Denali National Park and Preserve (Alaska) – 6.1 million acres
Death Valley National Park (California/Nevada) – 3.4 million acres
These vast protected areas provide critical habitats for thousands of plant and animal species, including numerous endangered ones.
Some of the most famous fauna found in national parks include the following (along with some national parks where you might see them):
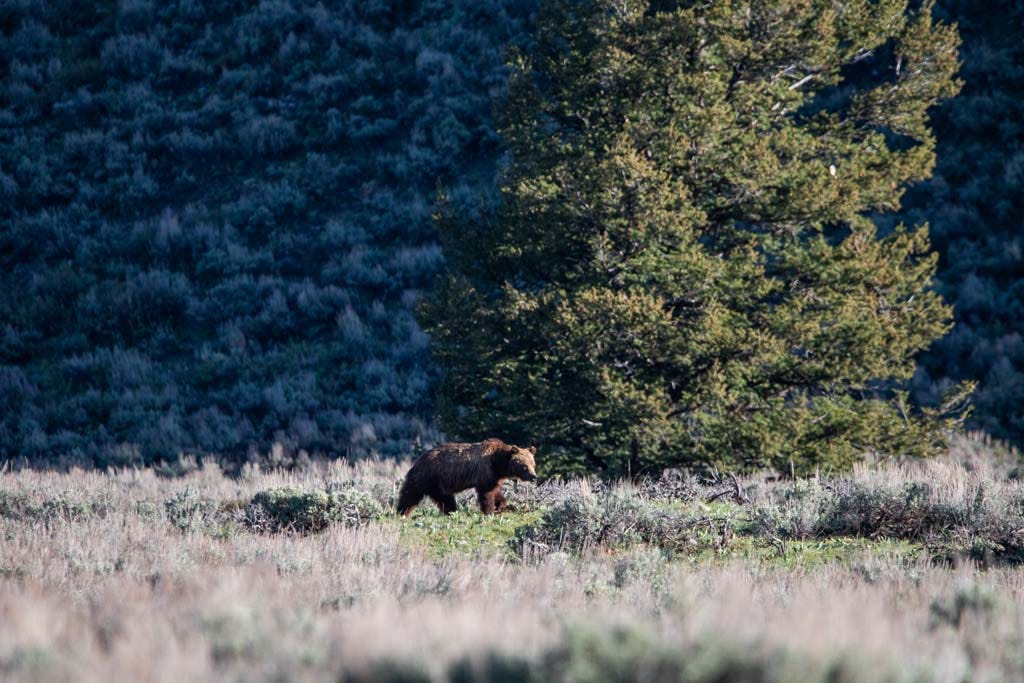
Grizzly bears (Yellowstone, Grand Teton, Glacier)
Bald eagles (Acadia, Everglades, Olympic)
Bison (Yellowstone, Badlands, Wind Cave)
Gray wolves (Isle Royale, Voyageurs, Yellowstone)
Moose (Grand Teton, Rocky Mountain, Isle Royale)
Alligators (Congaree, Everglades)
Orcas (Olympic, Glacier Bay, Kenai Fjords)
Additionally, the parks also protect countless plant species, from minuscule mosses and colorful wildflowers to giant cacti and towering trees. Some of the most iconic flora in the national parks include the following:
Saguaro cactus
Joshua tree
California fan palm
Coast redwood
Giant sequoia
Whitebark pine
Western larch
Bald cypress
Mangroves
Number of Deaths in National Parks
Between 2014 and 2023, a total of 3,081 people lost their lives while visiting a National Park Service site. On average, that's just over 308 people per year, or almost 6 people each week.
The top 5 leading causes of deaths in the National Park System are:
Fall (9.32%)
Drowning (13.79%)
Motor vehicle crash (16.26%)
Medical (18.11%)
Suicide (18.21%)
Learn more about the causes of death in national parks here.
Suicides are a national public health concern. The objective of collecting and analyzing suicide data is to support an informed discussion about suicides in national parks.
If you are in crisis or are thinking about suicide, please know that help is always available. Call or text the National Suicide Prevention Lifeline at 988, which can be reached 24 hours a day, 7 days a week. The service is available to anyone. All calls are confidential. http://www.988lifeline.org.
National Park Service Infrastructure and Maintenance Backlog
Managing 433 national park sites requires significant infrastructure and maintenance. The National Park Service oversees:
More than 75,000 assets, such as roads, bridges, trails, utility systems, historic structures, and campgrounds
Approximately 25,000 buildings
Approximately 17,000 miles of trails
More than 5,500 miles of paved roads
Despite these assets, the National Park Service has faced funding challenges for years, if not decades.
At the end of Fiscal Year 2024, the agency had accumulated an estimated $23 billion backlog in deferred maintenance projects, highlighting the dire need for continued investment in park infrastructure.
In other words, this means that the NPS needs an additional $23 billion in order to be able to repair aging or overused infrastructure.

Conclusion
U.S. national parks are more than just beautiful landscapes—they are economic powerhouses, vital conservation areas, and essential recreational resources for millions of people.
With 433 sites, over 330 million annual visitors, and an economic contribution exceeding $55 billion, the numbers reflect the immense value these parks provide to the nation.
Preserving and maintaining these natural treasures is a responsibility that ensures future generations can continue to experience their beauty and significance.